Running CLEAR: Mechanisms, Cadence, and the AI Productivity Balance Sheet
Part 2 of 4 · Enterprise AI Productivity series
[Recap line for readers arriving fresh: In Part 1, we laid out five fault lines behind 2026's enterprise AI measurement crisis and introduced CLEAR ( Clarify, Launch, Embed, Amplify, Review), a 5-phase loop for turning individual AI habit into governed organizational capability. This piece operationalizes it.]
Going Deeper: Tackling Fragmentation Layer by Layer
The CLEAR loop runs at three altitudes simultaneously, and most enterprises only ever measure one of them.
Individual layer. Habit formation, prompt literacy, and personal productivity proof points: the exact place where curiosity either becomes an owned habit or stays a side activity. Most organizations already track this; it's the layer every adoption dashboard covers.
Team layer. Shared playbook libraries, team-level usage-to-outcome linkage, manager-led review cadence. This is where the real operational lever sits: Microsoft's research shows organizational factors like manager support and team culture account for roughly twice the measured AI impact of individual usage (Microsoft WorkLab). Almost nobody measures it with the same rigor as the individual layer.
System/fabric layer. AI embedded directly into the workflow itself: governance rails, cost-to-serve visibility, and read-back architecture that closes the loop from action to outcome. This is where most enterprises never arrive, which is exactly why KPMG finds only 7% report established ROI even as 79% call AI a top investment priority.
The distinction that matters most here: action counts are not validated outcomes. Suggestions made or tasks created remain vanity metrics unless tied to a full lifecycle: suggested → reviewed → created → in progress → completed → outcome, where "outcome" means the targeted metric (churn risk, cycle time, pipeline velocity) actually moved over a 30, 60, or 90-day window. That requires read-back from the target system, not just write access. Very few organizations build this loop; the ones that do have a defensible efficacy story instead of an activity report, which provides the clearest way to answer the KPMG question when a CFO asks it.
Mechanisms to Motivate, Harden, and Scale Adoption
These concrete, operational levers directly address the failure modes documented in Part 1:
Hackathons and use-case sprints. Held on a quarterly cadence to force artifact production over idea collection: a use case only counts if it can enter CLEAR's Launch phase with a real baseline attached.
Usage review rhythms. Scheduled monthly at the team level and quarterly at the org level, where every review explicitly pairs usage data with outcome data. Usage alone is precisely what misled Uber: its own internal leaderboard ranked teams by token consumption, rewarding adoption without ever connecting it to shipped value. Any review that repeats that pattern repeats the mistake.
Drift observation. Borrowed from model/data drift monitoring, this means watching for when team level adoption plateaus, reverts, or quietly diverges from the hardened playbook. Most adoption programs skip this because it requires admitting that early wins don't automatically stay wins.
Recognition and incentive design. Reward validated outcomes rather than leaderboard position or raw usage, serving as the direct fix for the Uber pattern. Duolingo's own reversal is worth knowing here too: the company tied performance reviews to AI usage, then walked it back after employees noted the metric rewarded adoption for its own sake.
Champion and enablement network. Team-level owners who translate org-wide playbooks into local context. A central playbook rarely survives contact with a specific team's actual accounts or workflows unmodified; a named champion per team adapts it rather than expecting a one-size-fits-all rollout to stick everywhere.
The Quarterly Portfolio Cadence
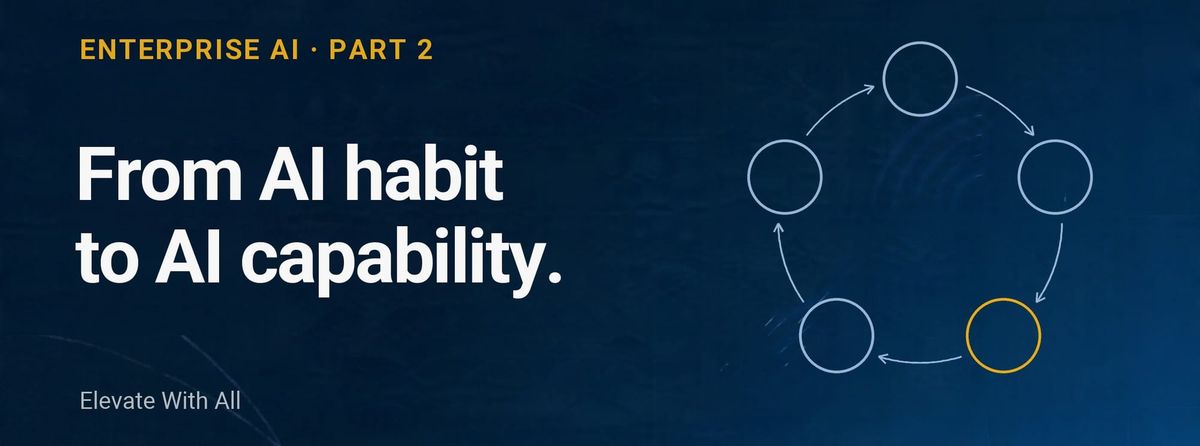
A full annual roadmap sounds tidy on a slide, but a fixed Q1-through-Q4 waterfall does not survive how fast this space moves; a plan written in January is stale by March. What holds up instead is a rolling quarterly cadence, where the organization always carries a live portfolio of use cases across every CLEAR phase at once: some in Clarify, some mid-Launch, some being Embedded, a few Amplifying, and a batch cycling through Review that feeds the next quarter's Clarify backlog. Every quarter runs the same review: not "did we hit the milestone," but "where does each use case sit right now, and what does it need to move forward?"
The discipline that makes this work isn't the cadence itself; it is budget visibility across the pipeline stages. Most finance functions can report total AI spend for the quarter. Very few can answer the harder question: how much is committed to early-stage pilots versus hardened workflows versus ungoverned experimentation that hasn't even entered Clarify. KPMG's own Q2 2026 research found only 26% of organizations report full, real-time visibility into what their AI systems cost to operate. (KPMG US, June 2026) Without that visibility, a quarterly review is just a status meeting.
That same visibility is what keeps governance and pace from fighting each other: it lets the organization move fast and know what it's spending at each stage, which is the real lesson underneath the Uber/Microsoft/Tesla caution from Part 1. None of those companies lacked speed. They lacked stage-level visibility into what that speed was costing.
The AI Productivity Balance Sheet & P&L
The signature artifact, and the one most enterprises genuinely cannot produce today.
The P&L view (in-year, expense-driven): token and license spend, cost-per-seat versus cost-per-active-user, hours reclaimed or cost avoided this quarter. Nearly every organization can produce this slide, as it is the one finance already asks for.
The balance sheet view (cumulative, capability-driven): number of use cases that made it through Launch's validation gate and got hardened into playbooks, percentage of workflows with true system layer embedding, and where the organization sits on a capability maturity curve year over year. Almost nobody produces this one.
KPMG's own data makes the case for why this distinction matters more than it sounds like it should: organizations with full visibility into their AI operating costs are five times more likely to report established ROI than those without (15% versus 3%). (KPMG.com) Visibility isn't a nice-to-have layered on top of the spend; it represents the difference between the large majority of organizations still guessing and the small minority that can actually defend their number to a board.
What goes into building this artifact is harder than the two-view summary suggests. A few design decisions matter enough to name, because most first attempts at an AI P&L trip over exactly these:
● The numbers must reconcile top-down and bottom-up, or the artifact is disqualified in front of a CFO. If a board view and a function's own dashboard add up to different totals for the same spend, the mismatch becomes the story. The fix is one shared data layer every view reads from, rather than each layer asserting its own figures.
● Attribution must separate AI's share from everything else that could explain the same result. A metric moving after an AI rollout isn't proof AI caused it, because pricing, seasonality, and headcount shifts move metrics too. A defensible P&L needs a contribution-mix view: AI's estimated causal share, named concurrent factors, and an honest residual.
● Funding source and workforce impact belong at the function level, not asserted from above. Only the team running a use case knows whether it displaced a tool, added net-new budget, or avoided a hire.
● A confidence tier belongs on every reported figure. Customer-confirmed, benchmark-modeled, and reasoned-estimate are not the same evidentiary weight, and collapsing them into one number erodes trust the first time someone asks "how do you know."
● A shadow AI rollup and a forward-looking run-rate belong on the same page as realized value; otherwise, the artifact reports what happened without flagging what's about to happen.
Building this properly is a genuinely different exercise from building a usage dashboard, which is why so few organizations get past the P&L view. I've been building a working prototype of this system: a threetier structure running from a board/portfolio view down to a CFO ledger down to function-specific dashboards for Customer Success, Sales, and Engineering, all reading from one reconciled data layer.
Close
Productivity becomes an organizational capability only when it's measured, governed, and compounded, not when it's merely adopted. The mechanisms, cadence, and balance sheet artifact in this piece are what make CLEAR something an organization actually runs, quarter over quarter, rather than a framework that looks good on one slide and never gets revisited.
One question remains open, and it's worth asking before any of this gets applied broadly: not every process belongs on the CLEAR journey in the first place. Some are better left to existing RPA, some genuinely need to stay human-led, and getting that call wrong upstream undermines everything downstream. That's Part 3: a companion framework called ROUTE. The dashboard prototype described above gets its own full walkthrough later in this series, once ROUTE has established which use cases actually belong on it.
This is Part 2 of a 4-part series on measuring enterprise AI productivity. Part 1 (the five fault lines and the CLEAR framework) is linked above; Part 3 (ROUTE: deciding what to automate, and how) and Part 4 (a walkthrough of the AI ROI dashboard) are coming soon.