
We Ask CSMs to Think Like Owners. Then We Pay Them Like Overhead.
CS 2030, Part 1 · Why the people closest to your revenue are paid furthest from it, and what to change before 2030.

Part 1 of 9 · CS 2030 series
Picture the last week of the quarter (a composite, but a familiar one). A $1M renewal that looked lost in the summer finally closes. The CSM spotted the risk early and ran the rescue.
Down the hall, an account executive closes $1M in new business. Same dollar, same week.
The AE gets a commission check. The CSM gets a strong rating from a calibration room she never sees, and hopes it shows up in next year's raise.
In 30 seconds
- The problem: Customer Success is measured like a revenue function and paid like a cost center.
- The evidence: in separate industry surveys, 93.7% of companies that measure CS impact hold it to a revenue target, while most CSMs have 20% or less of their pay at risk.
- The fix: run CS as a revenue engine, with one owner for the existing customer, pay on verified outcomes, and agents to scale it.
I've seen this pattern across SAP transformation programs and ISV/SaaS customer work. We rewrote what we expect from CS. We never rewrote how we organize, measure or reward it.
The revenue moved. The pay model didn't.
In ChurnZero's 2025 Customer Revenue Leadership Study, 74% of respondents said most of their revenue comes from existing customers. Consumption and outcome-based pricing push the same way: customers pay as they get value.
When value delivered becomes revenue, the person closest to the value sits closest to the money. That is usually the CSM.
| What we ask of CS | What we pay CS |
|---|---|
| 93.7% of companies measuring CS impact use a revenue target such as GRR or NRR (Gainsight 2025 CS Index, 400+ companies) | Most CSMs have 20% or less of pay as variable; only 5% have 40% or more, the mix typical for revenue owners (Mostly Metrics CS Survey, 132 tech companies, Jan 2026) |
| About half of CS teams own renewals and about 40% own expansion (ChurnZero, 1,000+ CS leaders) | Only 44% of CS teams were paid for expansion in 2024, down from 57% in 2023 (ChurnZero 2024) |
These are vendor surveys of different samples, so read them as direction. When pay stays the same whether a customer grows or churns, people learn that outcomes don't matter. You get compliance, not ownership.
To be fair to sales: winning a new logo is harder than renewing one, so a renewal dollar shouldn't pay like a new-logo dollar. The argument isn't equal pay. It's that a CSM's pay should move at all.
What to do with this:
- Build your own version of this table: what CS is measured on, who owns renewal and expansion, and how much CSM pay is variable.
- Put it on one slide for your CRO and CFO: the gap is hard to defend once it sits on one page.
- Size the exposure: ask finance what share of next year's revenue sits with existing customers.
Ratings sustain. Outcomes scale.
Annual ratings were built for sustaining work: deliver reliably, avoid mistakes, follow the process. Growth is a different job.
- Relative: a rating reflects your peers and the calibration room, not the value you created.
- Capped: curves limit how many people reach the top, however much the business grew.
- Visibility-biased: nobody applauds the fire that never started, like a renewal saved early.
- Caution-rewarding: with personal downside and capped upside, playing it safe is rational.
Ratings still belong in development and behavior. Growth needs a transparent, formula-based link between outcomes and income.
What the research says about pay design
- A floor plus upside works: when Safelite Glass moved installers to pay per windshield with an earnings floor, productivity rose 44% in six months (Lazear, 2000). Half came from more effort, half from who the model attracted. Installers aren't CSMs, but the mechanism carries over. Rule: keep a floor.
- A mix beats both extremes: in a Fortune 500 sales force study (Chung, Steenburgh and Sudhir, 2014), base plus commissions and bonuses was estimated to produce about 18% more revenue than pure commission. Rule: don't swing to all-variable.
- Line of sight beats a pooled bucket: group incentives invite free-riding. Rule: pay individuals on their own book.
- Poor design gets gamed: at one enterprise software vendor (Larkin, 2014), an accelerating commission plan led reps to time deals with deeper discounts, costing 6% to 8% of revenue. Rule: ask "how would I game this?" before launch.
Two industries already made this switch
| Healthcare | Wealth management | |
|---|---|---|
| Old model | Fee-for-service: paid per visit and procedure | Commission on each product sold |
| New model | Value-based care: paid on outcomes and total cost | Fee on assets managed: income grows only when the client stays and grows |
| Result | Medicare's Shared Savings Program saved $2.4B against benchmarks in 2024; three in four of 476 organizations earned shared savings | Asset-based fees were 72.4% of advisor compensation in 2024; Cerulli expects 77.6% of the industry to be fee-based by 2026 |
The caution is pace. Almost 60% of commission-based investors told J.D. Power they would likely move firms if forced into fee-only accounts (2015, Canada). Phase the change in. Analogies have limits, but the pattern holds: activity metrics and annual ratings are CS's fee-for-service, and the commercial CSM is our fee-based advisor.
By 2030, three forces make this urgent
- Pricing: consumption and outcome-based pricing keeps spreading, so revenue is earned as value is delivered.
- Agents: AI takes on monitoring, low-touch renewals and risk alerts, changing how many customers one person can serve.
- Growth math: with most revenue already coming from existing customers, retention and expansion drive growth and valuation.
A CS leader hired today can build toward 2030 within their tenure.
The CS 2030 thesis: run CS as a revenue engine
Three moves get us there:
- One owner for the existing customer: Sales wins the customer; CS grows it.
- Paid on verified outcomes: a secure base plus individual, outcome-linked incentives, with rates below new-logo commission and value gates and clawbacks as guardrails.
- Scaled by agents: routine work moves to AI agents, so cost to serve falls as coverage grows.
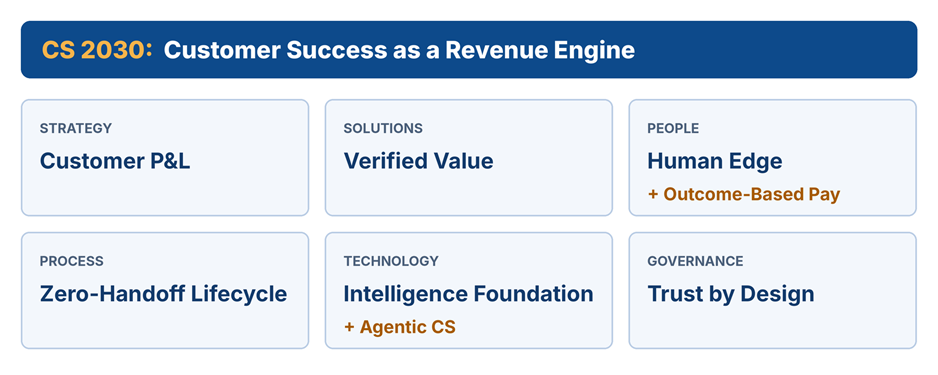
Fixing pay alone won't get us there. The full model spans six dimensions, and this series takes them one at a time.
Outcome pay is only fair if targets reflect each account's starting point. Otherwise CSMs compete for easy accounts instead of serving hard ones.
From the CS 2030 Toolkit: Account Propensity Index (sample)
Before any target is set, each account is scored on retention complexity (sponsor stability, competitive pressure, M&A or PE exit proximity) and expansion propensity (whitespace, the customer's own growth, industry tailwinds). Two illustrative accounts:
| Account A | Account B | |
|---|---|---|
| Retention complexity | High: sponsor just left; customer being acquired | Low: stable sponsor, no competitive pressure |
| Expansion propensity | Low: customer's market is shrinking | High: customer growing, large whitespace |
| Fair target | Protect retention; expansion target near zero | Expansion target above team average |
Same revenue, very different jobs. The full index weights each factor and sets each account's target band. If you'd like to pressure-test your own accounts against it, message me on LinkedIn.
What it's worth: $1M of ARR kept for $225K of pay
Illustrative. Every number is an assumption you can swap for your own.
| Assumption | Value |
|---|---|
| ARR up for renewal | $50M |
| Gross revenue retention today | 90% ($5M lost a year) |
| CS team | 10 CSMs at $150K on-target earnings |
| Pay change | Variable share rises from 15% to 30% |
| Gross margin | 80% |
- Upside: if outcome pay lifts retention by 2 points, that's $1M of ARR kept each year, about $800K of recurring gross profit.
- Cost: funded as new money, the extra variable pay is at most $225K a year at target, paid only when outcomes land.
- Payback: about 3 to 4 months of retained gross profit covers it.
- Risk and guardrail: if retention doesn't move, the extra pay doesn't go out; value gates and clawbacks stop rewarding renewals that churn soon after.
For a PE operating partner or VC board, this is a retention and margin story. It targets NRR, GRR and gross margin, and turns part of CS cost from fixed overhead into cost that moves with results.
Red Flags: is your CS model still built for 2020?
- Flat pay: your CSMs earn the same whether a key account renews or churns.
- Low variable: 20% or less of CSM pay is at risk.
- Rating, not reward: a saved renewal earns a rating, not a payout.
- Lost credit: expansion credit goes to sales even when CS found the opportunity.
- Two owners: customers have separate contacts for renewal and expansion.
- Pooled bonus: bonuses come from a bucket spread through ratings.
- One-size targets: every CSM's targets are set the same way, whatever the account's starting point.
- Linear headcount: CS headcount rises in step with customer count.
If three or more are true, this series is for you.
Signals that would prove this right or wrong
If CS 2030 is right, these keep moving. If they stall or reverse, I'll rethink the thesis.
- Ownership: more CS teams own renewals and expansion.
- Reporting lines: more CS organizations report to a revenue leader.
- Pricing: consumption and outcome-based pricing keeps spreading.
- Pay mix: the variable share of CSM pay rises above today's typical 20%.
- Cost to serve: revenue per CSM rises, without retention falling.
Bring this to your next CS staff meeting
Twenty minutes, three questions. Keep the answers; later parts build on them.
- Pay movement: what share of a CSM's pay moves when a customer renews or churns?
- Growth upside: does anyone on the team earn more when a customer grows?
- Credit: when a renewal is saved, who gets the credit, and how is it recognized?
Next in CS 2030: Sales Wins the Customer. CS Grows It.
Most SaaS companies give the existing customer two owners, and customers feel every handoff. Part 2: Sales Wins the Customer. CS Grows It., with the Customer Ownership Model and the one org change that ends the split between account management and CS.
Your turn
If you could change one thing about how CS is measured or rewarded, what would it be? Tell me in the comments.
Get each new CS 2030 part, with its toolkit sample, in your inbox.
Sources
- ChurnZero 2025 Customer Revenue Leadership Study
- ChurnZero 2024 Customer Success Leadership Study key findings
- Gainsight: What CS teams are prioritizing in 2026 (2025 CS Index)
- Mostly Metrics: The Customer Success Survey benchmarks (Jan 2026)
- Lazear, Performance Pay and Productivity (American Economic Review, 2000)
- Chung, Steenburgh, Sudhir, Do Bonuses Enhance Sales Productivity? (Marketing Science, 2014)
- NB Forum: Harvard study on sales compensation plans
- Larkin, The Cost of High-Powered Incentives (Journal of Labor Economics, 2014)
- Fierce Healthcare: Medicare ACOs saved $2.4B in 2024
- Health Affairs: Medicare ACOs in 2024
- InvestmentNews: Cerulli on fee-based advisor models
- Financial Planning: J.D. Power on commission clients and fee-only switch
Several CS benchmarks cited come from CS platform vendors' surveys; I've used them for direction rather than precision. Views are my own.