CS 2030 Part 4: Outcome Pay for CS Costs Less Than You Think
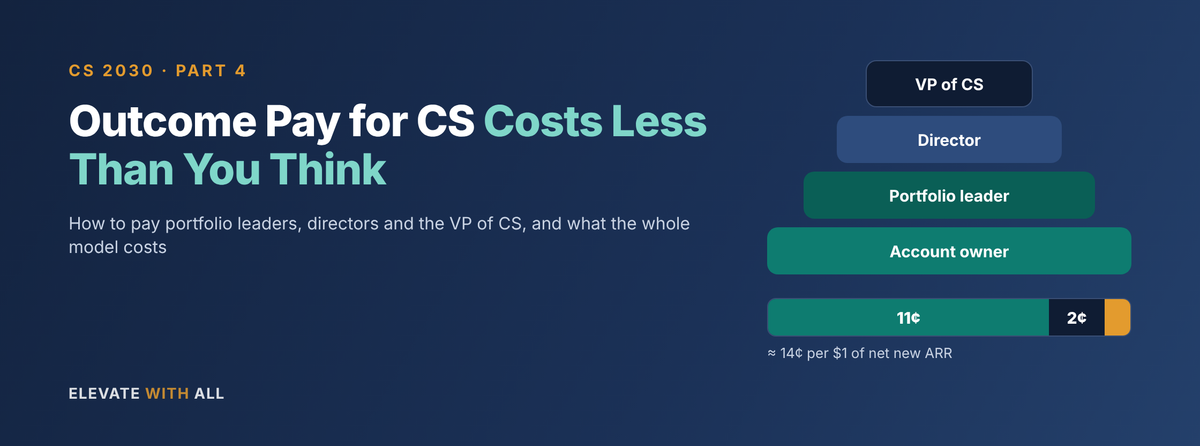
CS 2030, Part 4. How to pay the leaders above the account owner, from portfolio leader to VP of CS, and what the whole model costs. In an illustrative company, variable pay across every level comes to about 13% of net new ARR.
Part 4 of 10 · CS 2030 series
A portfolio leader hits 118% of target (a composite). The celebration is real. Then someone looks closer: one owner had a breakout year, three missed, and two books sat vacant for a quarter while the leader covered them. The plan paid on the total, so none of that showed. Next year, the leader asks to spread the strongest owner's accounts across the team, and is told no, because the plan never rewarded it.
In 30 seconds
- The problem: leader pay breaks through double credit, superstar-carried teams and vacant books, and finance can't see the total cost.
- The evidence: in an illustrative $384M company, variable pay across all four levels is 13% of net new ARR, and a strong year costs 18% more for 50% more growth.
- The fix: measure wider and pay on a longer clock at each level, grow equity with level, and publish the cost of every ARR dollar across the pyramid.
Part 3 covered how to pay the account owner. This part covers everyone above them, and answers the CFO's question: what does it cost?
Leader pay breaks in three predictable ways
Each one is a design gap, not a people problem.
- One superstar carries the team: the leader hits target on the total while most of the team misses.
- Double credit nobody planned for: owner, leader and director are all paid on the same dollar. That's normal, but unbudgeted, it makes the plan look expensive the moment it works.
- Vacant books and moves: without rules, credit gets negotiated, and negotiation is where trust goes.
Measure wider and pay slower as you go up
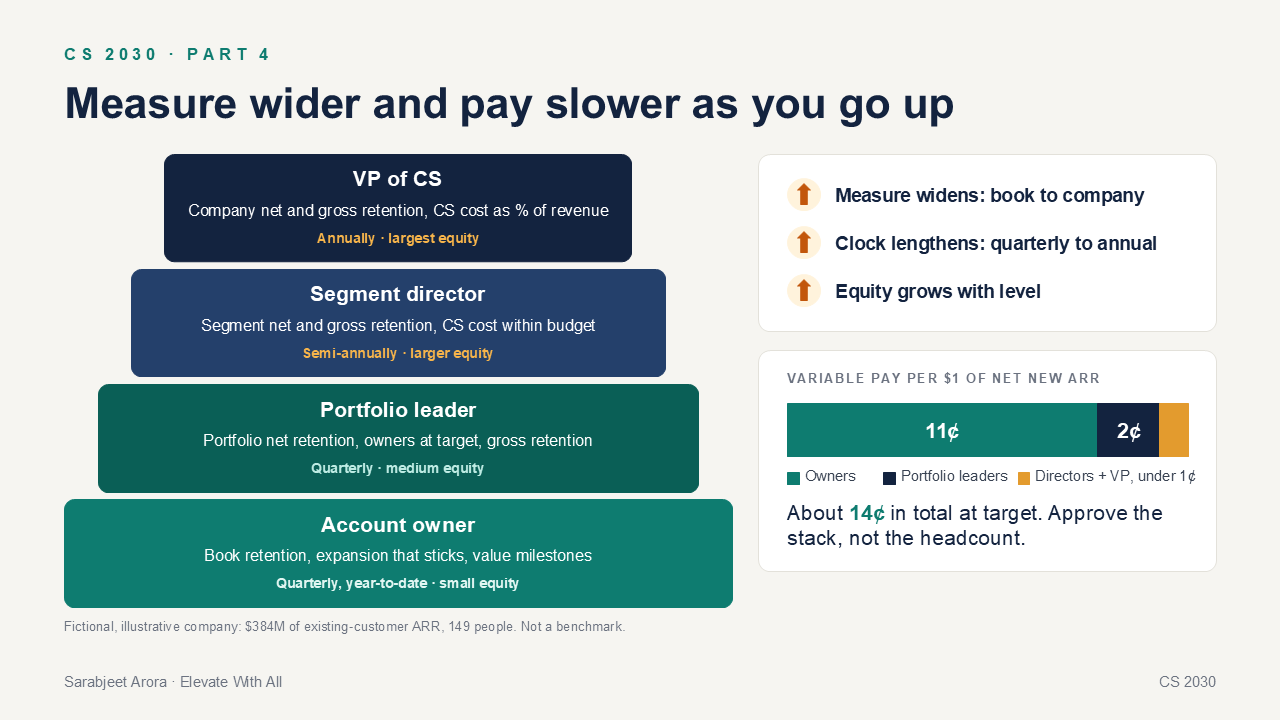
The four layers from Part 3 apply at every level. What changes is how wide the measure is, how often it pays, and how much equity sits alongside the cash.
| Level | Typical scope | Cash mix | Variable measured on | Paid · Equity |
|---|---|---|---|---|
| Account owner | One book | 65/35 to 75/25 | Book retention, expansion that sticks, value milestones | Quarterly · small |
| Portfolio leader | 6 to 10 owners | About 70/30 | Portfolio net retention, share of owners at target, gross retention | Quarterly · medium |
| Segment director | Several portfolios | About 75/25 | Segment net and gross retention, CS cost within budget | Semi-annually · larger |
| VP of CS | Whole customer base | About 70/30 | Company net and gross retention, CS cost as a share of revenue | Annually · largest |
The measure widens because the job shifts from closing the account to shaping the system. The clock lengthens because a director's decisions take longer to show up in retention. Portfolio leaders stay quarterly for the same reason owners do: a Fortune 500 sales-force study found quarterly bonuses paced effort better than annual ones (Chung, Steenburgh and Sudhir, 2014). The rule: match the payout clock to how fast each level's decisions show up.
Objections answered: the rules that keep leader pay honest
| Objection | Rule |
|---|---|
| "We pay three people for one dollar." | Expected and budgeted. Publish what each level earns per dollar of ARR, so the total is known in advance. |
| "Owners' targets add up to more than mine." | They should, by about 5–15%, to cover vacancies and attrition. Publish the percentage. |
| "One star is carrying my number." | Include a distribution measure: the share of owners at or above target. |
| "I covered a vacant book for a quarter." | The leader covers it. Targets and credit are prorated by days owned. |
| "They'll hit it with discounts or extra headcount." | Gross retention gates the variable, and only approved discounts count at pre-discount value: the manager up to about 5–10%, finance above. Directors and above also carry CS cost and discount rate within budget. |
| "What about coaching and hiring?" | Base, promotion and equity, not a formula. Soft objectives in a bonus become a second calibration week. |
Myth: equity can replace the outcome incentive
Many companies pay leaders in three currencies: base, variable and equity. The research says what equity does and doesn't do. A meta-analysis of 102 samples covering 56,984 firms found a small but positive, statistically significant link between employee ownership and firm performance (O'Boyle, Patel and Gonzalez-Mulé, 2016). The NBER Shared Capitalism study linked profit sharing and ownership to more loyalty and effort and lower intent to leave, especially where fixed pay was at or above market. There, the share of workers very likely to leave fell from 12.8% to 2.4% (Blasi, Freeman, Mackin and Kruse, 2008). Its 14 firms chose to take part, so the sample isn't representative.
The rule: equity keeps people over years, but barely changes this quarter, because nobody can see their effect on the share price. Grow equity with level, tie refresh grants to two strong years, and never use it in place of the outcome incentive. The same study found lower-risk forms like profit sharing and gainsharing had some of the strongest effects, which is why the shared kicker in Part 3 is funded only by growth above plan.
Sharing growth pays for itself, when it's paired with individual line of sight. A 2020 meta-analysis of 56 studies found profit sharing is linked to higher productivity, especially where employees take part in decisions (Doucouliagos and others). In a randomized experiment across 193 retail shops, team bonuses lifted sales by about 3%, and each dollar of bonus returned $2.10 in profit. But peer pressure did little to stop free-riding (Friebel and others, 2017). Companies are moving this way: in October 2026, Micron announced quarterly profit-linked payments for employees worldwide, half in cash and half in shares. The rule: share growth with everyone to keep people, keep individual outcomes in the formula so effort has a clear line of sight, and keep the base secure for the years when profit sharing pays little.
From the CS 2030 Toolkit: one company, a realistic year
A fictional, illustrative public SaaS company with $384M of existing-customer ARR: 128 owners with $3M books, 16 portfolio leaders, 4 segment directors and one VP of CS. In each portfolio of eight, two owners have a breakout year, four land on plan, one has a quiet book and one loses a large account. Portfolio net retention is 123%.
| Level | People | Target variable | Actual variable | Cash each | Layer cash as % of book |
|---|---|---|---|---|---|
| Account owner | 128 | $65k | $68.4k average | $218.4k average | 7.28% |
| Portfolio leader | 16 | $95k | $115.8k (122%) | $335.8k | 1.40% |
| Segment director | 4 | $100k | $114.3k (114%) | $409.3k | 0.43% |
| VP of CS | 1 | $175k | $200.0k (114%) | $600.0k | 0.16% |
| Total | 149 | $11.26M | $35.56M | 9.26% |
Variable pay is $11.26M: 2.9% of the book and 12.9% of the $87.4M of net new ARR. The three leader levels add less than one percentage point on top of the owners, even though everyone is credited on the same ARR.
Seen per dollar, the stack is easy to read. At target, owners earn about 11 cents of variable on each dollar of net new ARR, portfolio leaders about 2 cents, and directors and the VP together under a cent. Where an enterprise owner works with a specialist, add the specialist's assist rate on top. That stack, not the headcount, is what finance should approve each year.
What it's worth: the CFO's view across four years
Owners' variable pay in the same illustrative company. Assumptions: $3M books, a 120% net retention plan and Part 3's owner rules. Swap in your own.
| Year | Net new ARR | Owners' variable | vs. budget | As % of net new ARR |
|---|---|---|---|---|
| Every book on plan (120%) | $76.8M | $8.32M | 100% | 10.8% |
| Realistic mix (above) | $87.4M | $8.75M | 105% | 10.0% |
| Strong year (130%) | $115.2M | $9.83M | 118% | 8.5% |
| Weak year (110%) | $38.4M | $7.31M | 88% | 19.0% |
- Budget for the spread: a mixed year costs more than an even one at similar revenue, so budget at about 105–110% of target.
- A strong year is cheap growth: payout rises 18% while net new ARR rises 50%, and that ARR recurs.
- A weak year still pays for retention: the ratio rises because owners are paid to protect the base. That's the plan doing its job.
Finance governs it all with two numbers: the maximum cost (every role's ceiling times headcount) and pay as a share of net new ARR, kept within an agreed band.
Team exercise: add up one dollar
Bring this to your next CS leadership meeting:
- Stack: what does every level earn on the same dollar of renewed or expanded ARR?
- Ceiling: what is the maximum payout if every role hits its cap?
- Signal: which leader measure would show a superstar carrying a team?
The stance
The cost of customer success isn't a fixed overhead. It's a stack of design choices: how wide each level is measured, how often it pays, how much is equity, and what each ARR dollar costs across the pyramid. Make those choices on purpose and publish them. My view: if pay as a share of net new ARR keeps rising while growth falls for two years, the weights are wrong.
Next in CS 2030, next week: Cost to Serve Is a Design Choice. Once ownership and pay are aligned, how do you make the whole model affordable? All parts are on the CS 2030 hub.
Your turn
Does anyone in your company know what every CS level earns on the same renewed dollar?
The floor-to-maximum cost table for every level is free for members.
If you'd like to pressure-test this against your own organization, message me on LinkedIn.
Disclaimer: this is a personal perspective, written in my own capacity. It is not connected to, endorsed by or based on any information from my employer. All pay figures, companies and scenarios are illustrative and fictional, not drawn from any employer's pay plans or data. Research on sales forces, profit sharing and employee ownership is used for direction, not as CS benchmarks. Views are my own.
Sources
- O'Boyle, E. H., Patel, P. C. and Gonzalez-Mulé, E., Employee ownership and firm performance: a meta-analysis, Human Resource Management Journal, 2016
- Blasi, J. R., Freeman, R. B., Mackin, C. and Kruse, D. L., Creating a Bigger Pie? The Effects of Employee Ownership, Profit Sharing, and Stock Options on Workplace Performance, NBER Working Paper 14230, 2008
- Doucouliagos, C., Laroche, P., Kruse, D. L. and Stanley, T. D., Is Profit Sharing Productive? A Meta-Regression Analysis, British Journal of Industrial Relations 58(2), 2020
- Friebel, G., Heinz, M., Krueger, M. and Zubanov, N., Team Incentives and Performance: Evidence from a Retail Chain, American Economic Review 107(8), 2017
- Reuters via Devdiscourse, Micron unveils global profit-linked bonus plan after Taiwan union pressure, October 2026 (news report)
- Chung, D., Steenburgh, T. and Sudhir, K., Do Bonuses Enhance Sales Productivity?, Marketing Science, 2014